

The Density Functional Perturbation Theory (DFPT) module of our atomistic tool RESCU provides a way to efficiently simulate materials response functions, which are directly measured in experiments to gain greater insight on a material. In our previous posts, we showed how RESCU-DFPT is used to compute the responses to atomic displacements, static electric fields and combinations of the two, i.e., phonons, ion-clamped dielectric constant and Born effective charges, respectively. In this post, we show that infrared spectrum optical properties can be simulated too.
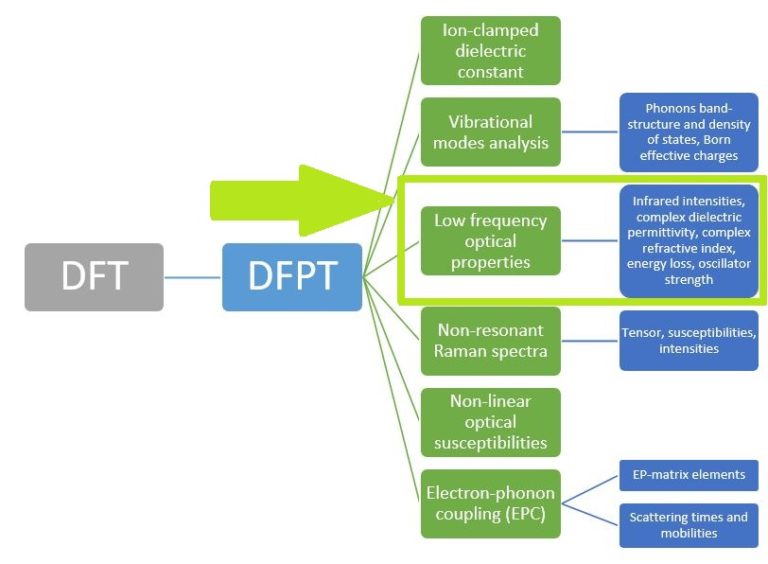
Figure 1. List of our core RESCU DFPT features.
The response of many materials to an external electromagnetic field in the infrared region is dominated by lattice vibrations. Infrared photons are not energetic enough to cause electronic transitions, however their energy is sufficient to drive long-wavelength phononic transitions. That’s why infrared spectroscopy is a powerful technique for probing vibrational properties of materials.
Infrared spectroscopy data can be corroborated and predicted by theory and simulating how the atoms in a lattice vibrate. Atomistic simulations can be used in interpreting experimental findings, and in addition provide us with information that cannot be experimentally measured like wavefunctions. To illustrate this, we calculate and analyze the optical spectra of aluminum nitride (AlN) in its hexagonal structure using the local density approximation (LDA) for the xc-functional (exchange-correlation). We compute the (frequency dependent) complex dielectric permittivity and derive the refractive index, as well as the infrared intensities along the c-axis of the crystal. These are the most important optical properties.
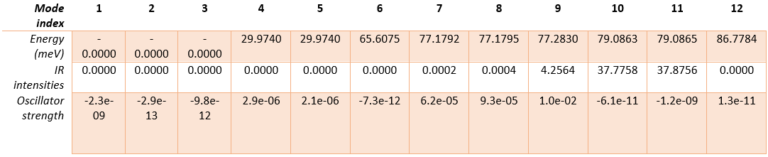
Table 1. Calculated energy, infrared intensity, and oscillator strength for all phonon modes in hexagonal AlN.
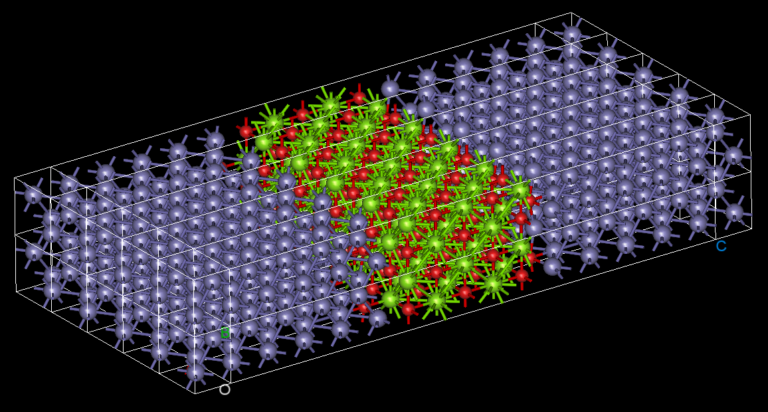
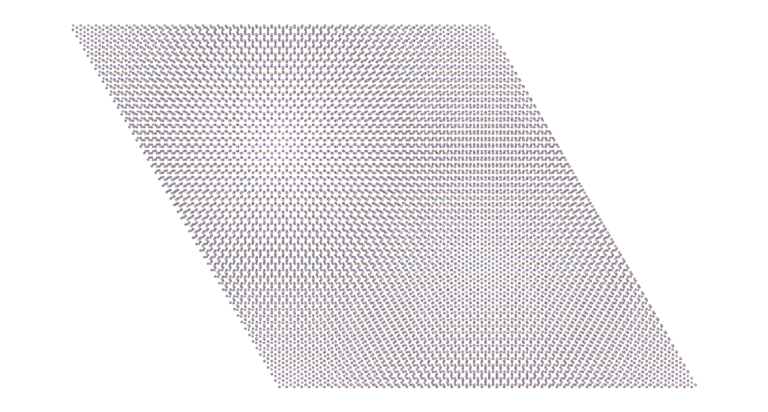
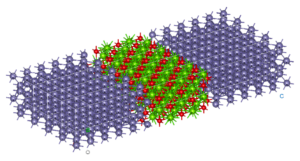
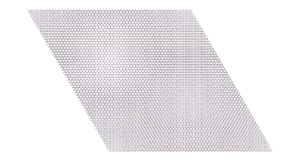
The hexagonal AlN lattice has a primitive cell containing 2 aluminum and 2 nitrogen atoms. There are therefore 12 vibrational modes: three acoustic and nine optical. Examining the IR intensities reveals that only three phonon modes are IR active. Modes 7 & 8 (@77.18 meV), modes 9 (@77.28 meV) and modes 10 & 11 (@79.09 meV), among which the later modes have the largest IR intensities. These predictions perfectly match the experimentally observed IR intensities [1]. Unlike experiments, simulations yield the atomic displacements of each vibrational mode, which gives further insights. The IR active modes are represented in Figures 2-1 to 2-5. For instance, we can see that for modes #7 and #8, the atoms vibrate in-plane and in mode #9 they vibrate along the c-axis (Figures 2-1 to 2-3.).
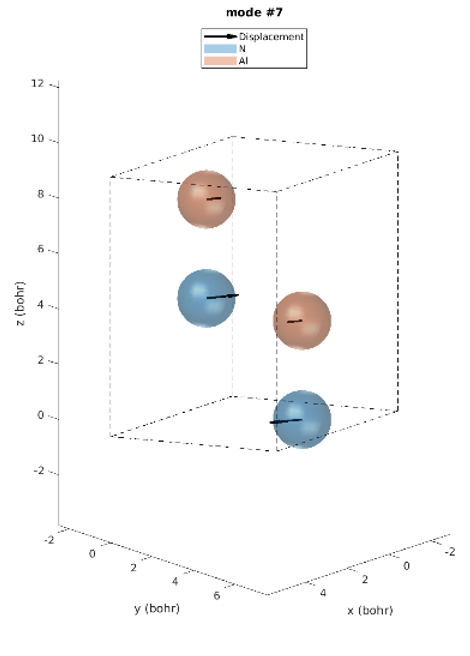
Figure 2-1. Phonon mode #7
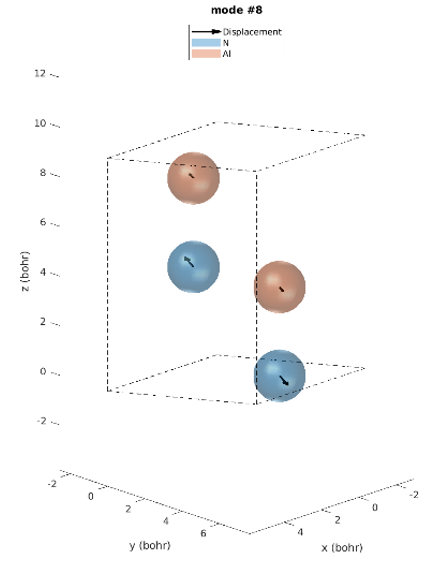
Figure 2-2. Phonon mode #8
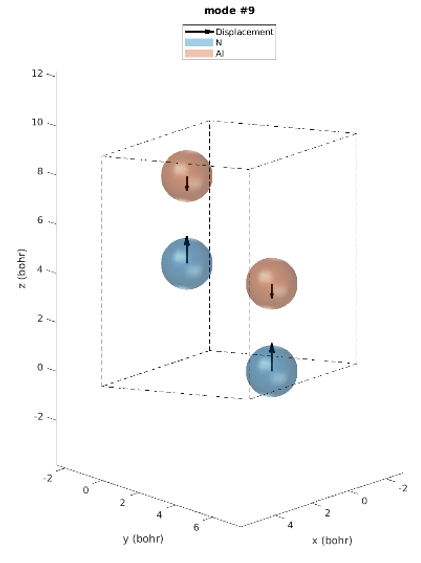
Figure 2-3. Phonon mode #9
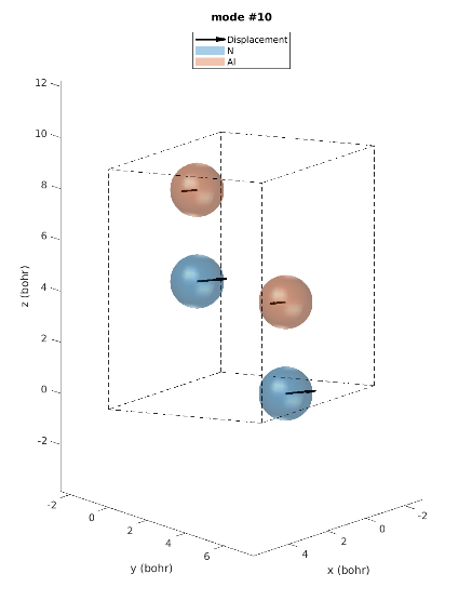
Figure 2-4. Phonon mode #10
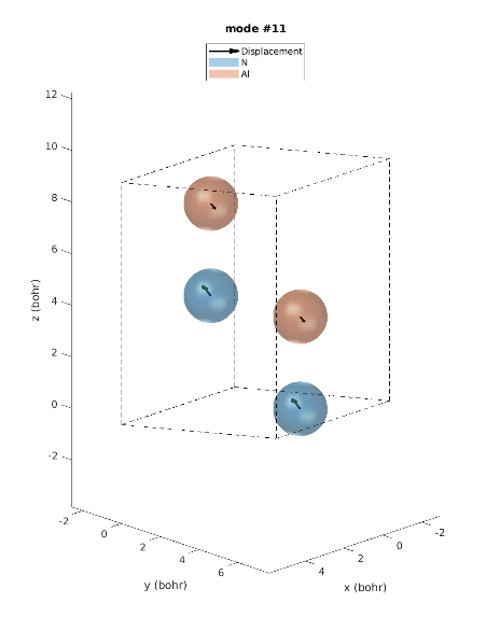
Figure 2-5. Phonon mode #11
We also compare the simulated dielectric permittivity and refractive index with experimental data [1] shown in Figure 3 hereafter. We predict 4.65 for the high-frequency dielectric constant which compares well with the experimental value of 4.84. The experimental spectra are extracted from the reflectance spectra using the Kramers-Kronig analysis.
According to these figures, the DFPT simulations capture the key features of optical spectra. From the spectral analysis, we conclude that the main feature corresponds to a TO phonon mode (Transverse-Optical) whose frequency is extracted from the maximum of the refractive index, at 82.7 meV. The spectral features directly depend on the oscillator strength, obtained in simulations, and Table 1 clearly shows that mode #9 @77.28 meV has an oscillator strength significantly larger than other modes.
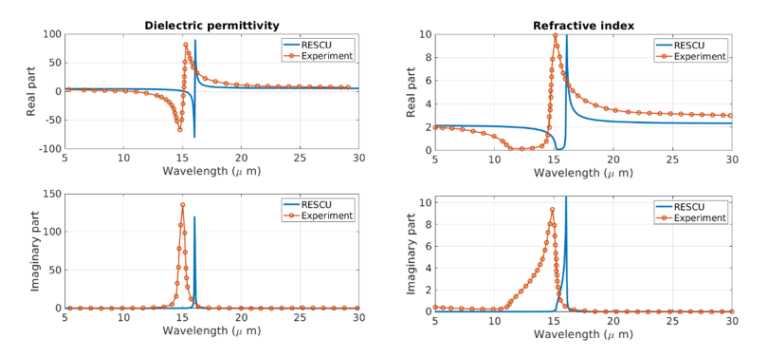
Figure 3. Dielectric permittivity and refractive index of AlN. The experimental results are in orange and the RESCU predictions in blue.
To summarize, several optical properties of AlN can be computed by DFPT using our RESCU code. This information can be used to validate experimental assumptions, for example to confirm the purity of the material and its dominant phase (hexagonal AlN in our example), or learn more about materials that are experimentally difficult to synthetize or study.
In a forthcoming publication here on LinkedIn, we will show how the DFPT module of RESCU is also used to compute Raman spectrum and intensities in infrared regions, which characterizes the inelastic interaction of photons with long-wavelength phonons in materials.
We hope you enjoyed the read, thank you and feel free to comment and ask us as usual now some specific information about our atomistic tools, we will be more than happy to give additional insights.
Take care!
[1] Lattice Vibration Spectra of Aluminum Nitride, A. T. Collins, E. C. Lightowlers, and P. J. Dean, Phys. Rev. 158, 833